
When the new Health Secretary, Therese Coffey, was appointed she detailed her priorities for the NHS. These were A, B, C, D, or in other words, ambulances, backlogs, care, and doctors and dentists.
Critical to the current challenges facing the health system is the ability to create and ensure bed capacity. Currently, one out of every six beds are taken up by a patient who no longer requires it. Furthermore, without this bed capacity, it will be impossible to deliver the ambitions of NHS England’s CEO Amanda Pritchard’s around recovery, reform, resilience, and respect (her “4 Rs”).
With an elective backlog of almost seven million, one in eight people across England are currently waiting for operations and other types of care, and ambulance response times at an all-time worse. Unprecedented operational challenges are anticipated for the winter period.
One of the Government’s responses to this problem is the new Discharge to Assess (D2A) programme. This aims to discharge a greater proportion of patients when they no longer require the direct support of an acute bed. They may require further care but can have their longer-term care and support needs undertaken in a more appropriate setting. Four pathways have been established within this D2A programme. They are summarised below.
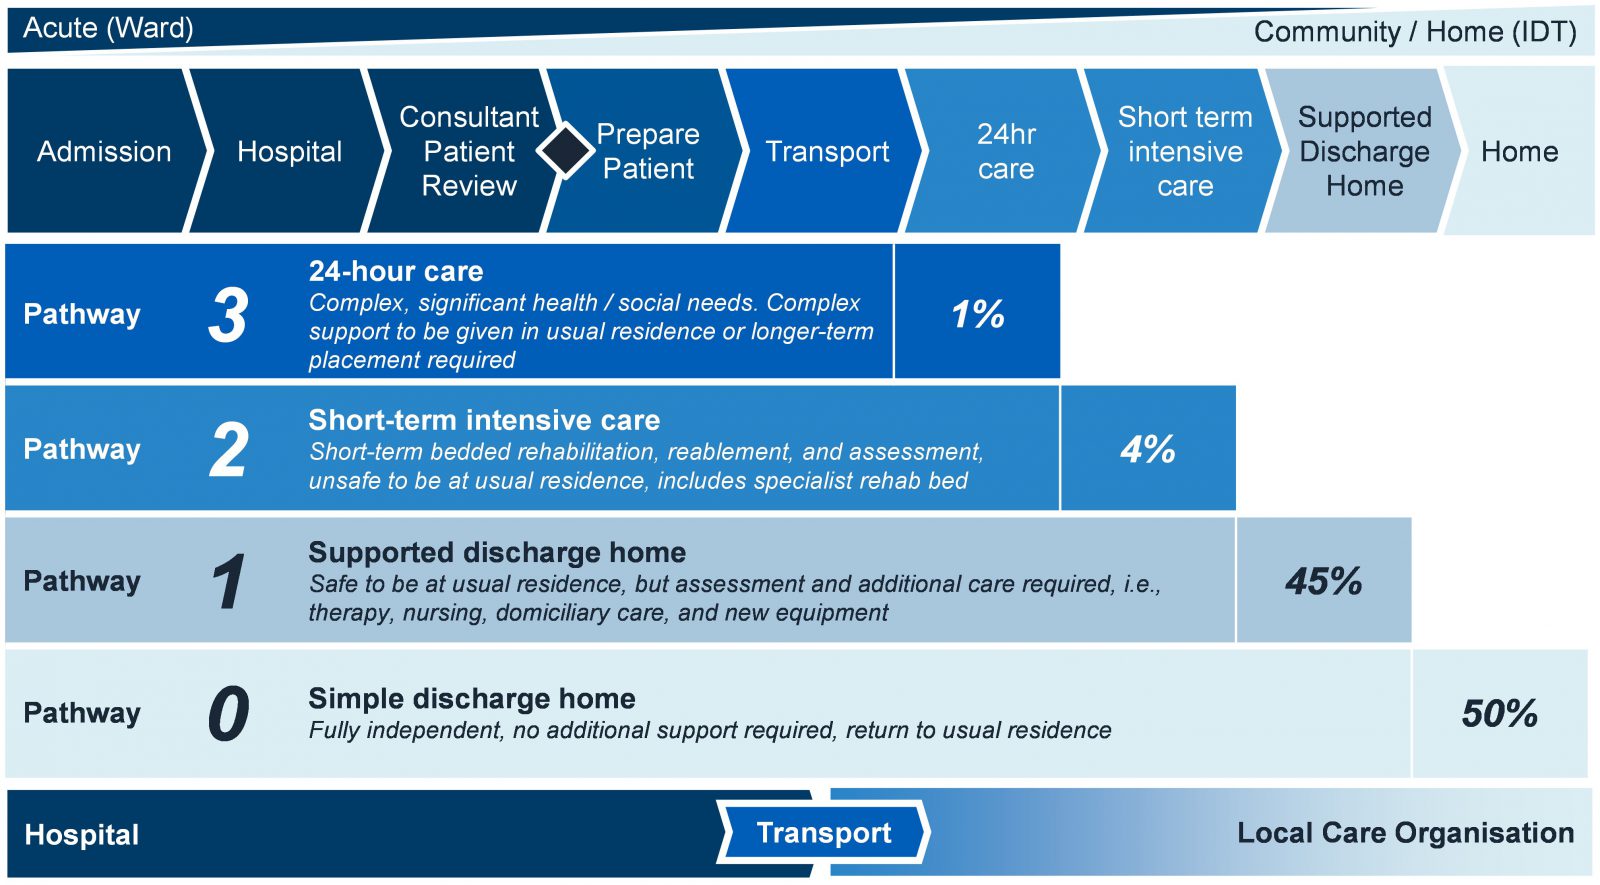
As in any production flow environment, effective and efficient flow of D2A requires a balance of push and pull on the Hospital and Local Care Organisations respectively.
Discharge Performance
Reasons Behind Delayed Transfers of Care
Before looking to implement solutions to enable the D2A programme, it is imperative to understand the current and historic blockers to discharge. Analysis of delayed transfers of care data highlights these blockers as well as historic performance. Since 2010, there has been a 75% increase discharge delays measured by the increase in volume of additional hospital days resulting from delayed transfers of care.
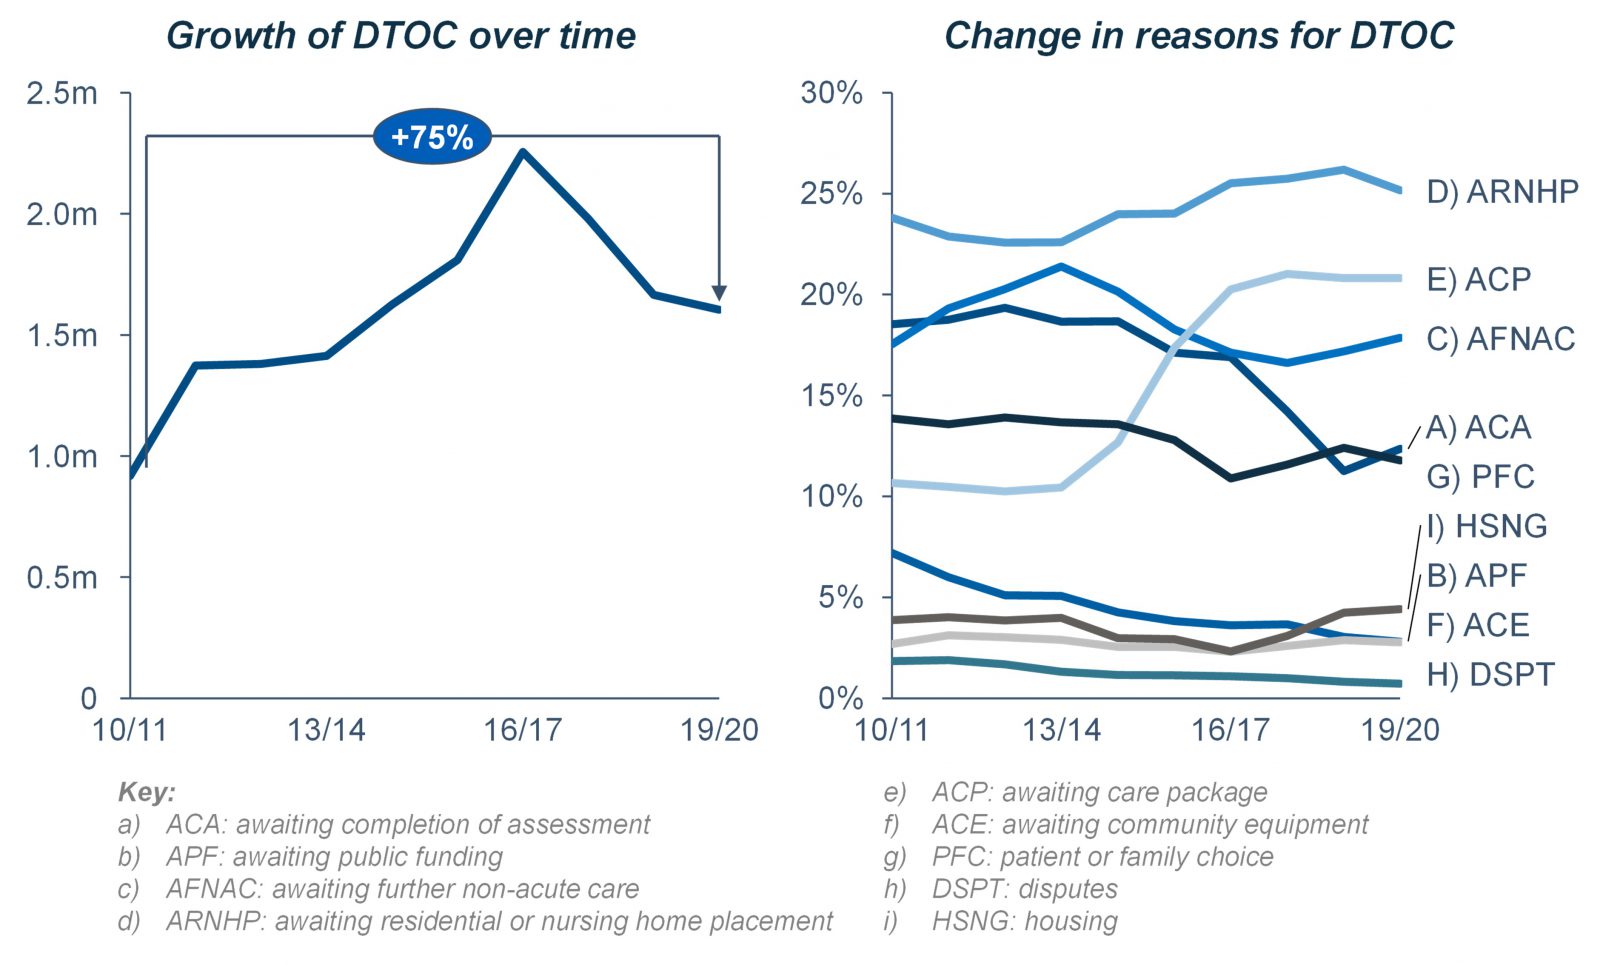
Due to COVID, and the subsequent operational pressures, DTOC data is no longer published by NHS Digital. In 2019/20, there were 1,600,000 additional hospital days generated by delayed transfers of care.
The most common reason for these delays was the lack of capacity within the residential or nursing care home setting (ARNHP) accounting for a quarter of all delays. The two next greatest discharge blockers were the need to wait for a care package (ACP, 21%) and the need to wait for further non-acute care (AFNAC, 18%). Both of these blockers can be theoretically readily addressed by the discharge to assess programme. However, the ability for systems to combat the greatest blocker, a lack of capacity within the residential or nursing care home setting, in regard to D2A programmes should be carefully considered.
Current Discharge Performance
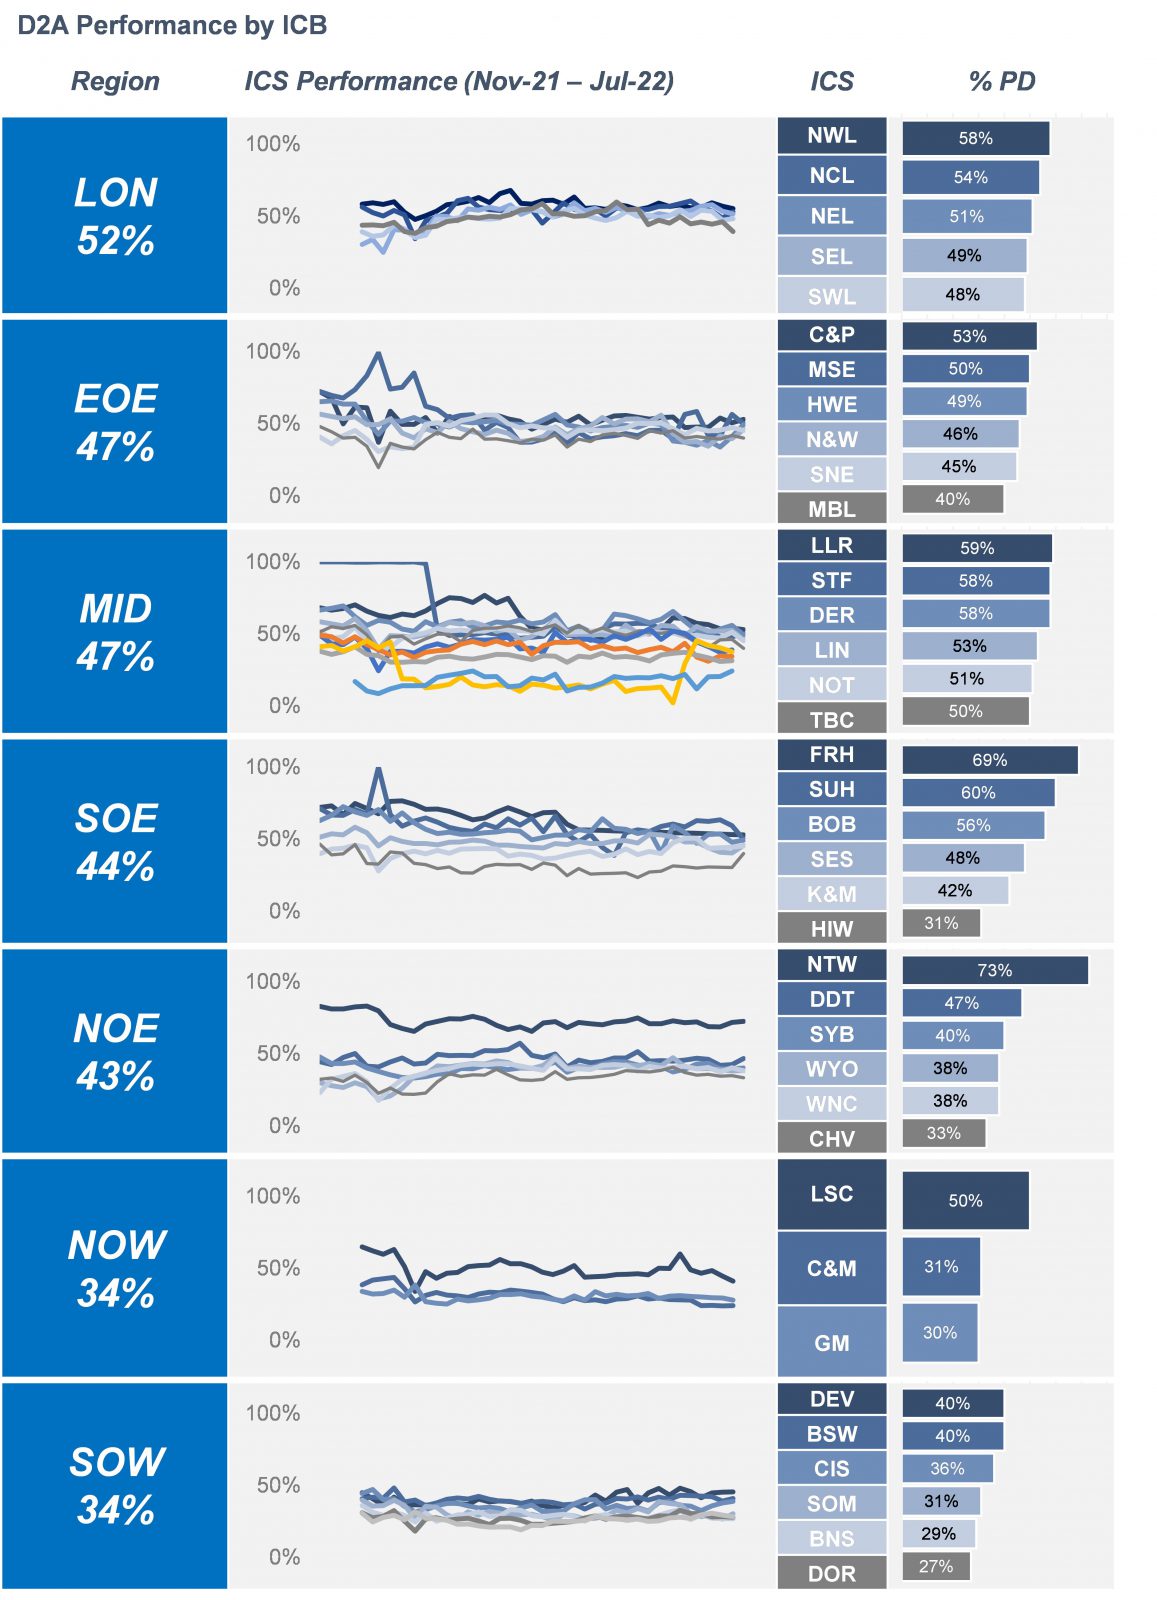
National data shows that current discharge performance across England varies widely and is significantly below NHSE’s target of discharging half of those with no right to reside, with an average discharge performance rate of 43%.[2] This equates to almost 3,000,000 instances over nine months where a patient was eligible for a discharge but remained in hospital. Or, in other words, 12,000 patients everyday remain in hospital when they should be discharged.
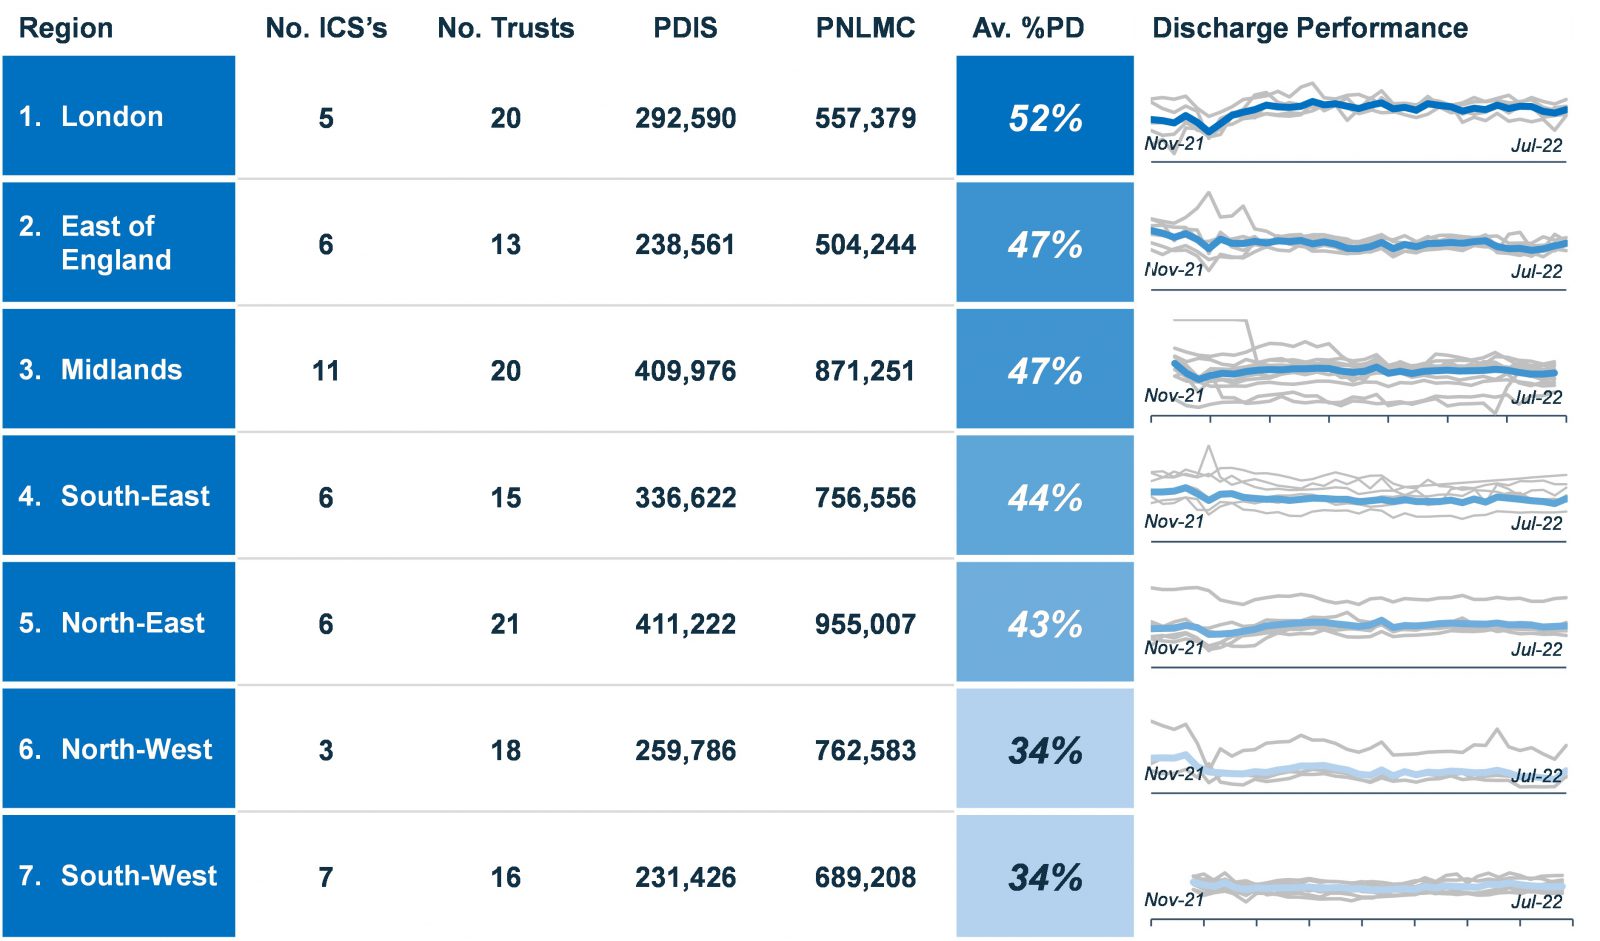
Furthermore, London is the only region achieving a discharge rate of half of patients who are eligible at 53%. All other regions are below this threshold. The South West and North West regions have both been operating at an average discharge rate of 34%. In fact, London is the only region performing stronger now than in winter 2021.
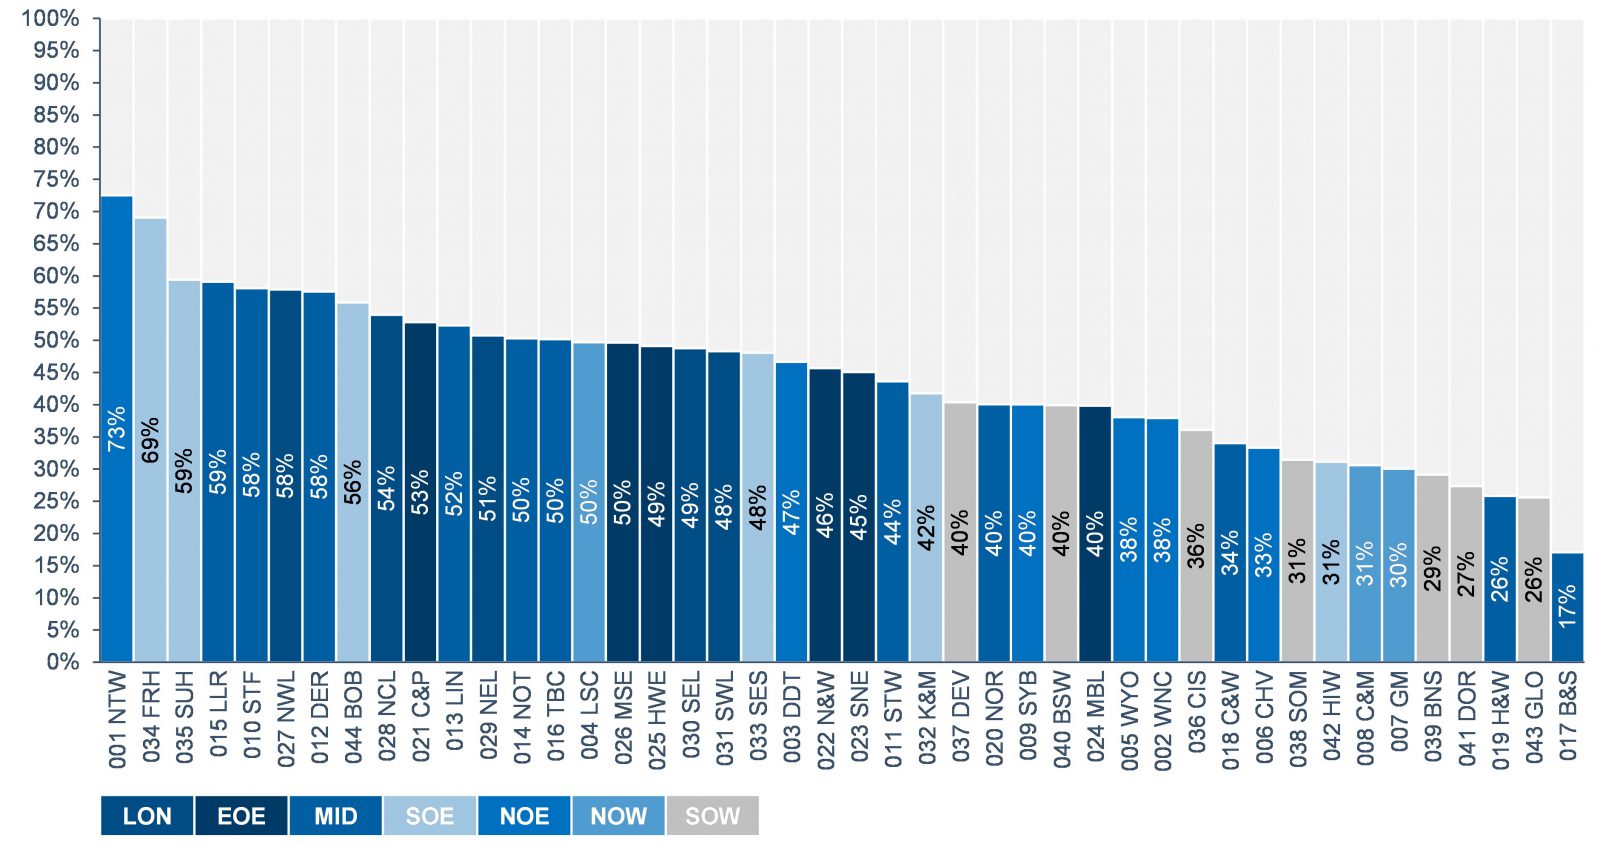
Analysis at an ICB-level portrays a similar message; performance is widely variable. On one hand, the highest performing ICS, Northumberland, Tyne, and Wear achieved an average discharge of 73%, whereas the lowest performing ICS, Birmingham and Solihull, achieved 17%.
Only 14 of the 44 ICS’s achieved an average performance rate of above 50% (full details of discharge performance by ICS can be seen within the appendix). Moreover, the South West region were the only region not to have an ICS currently meeting this target.
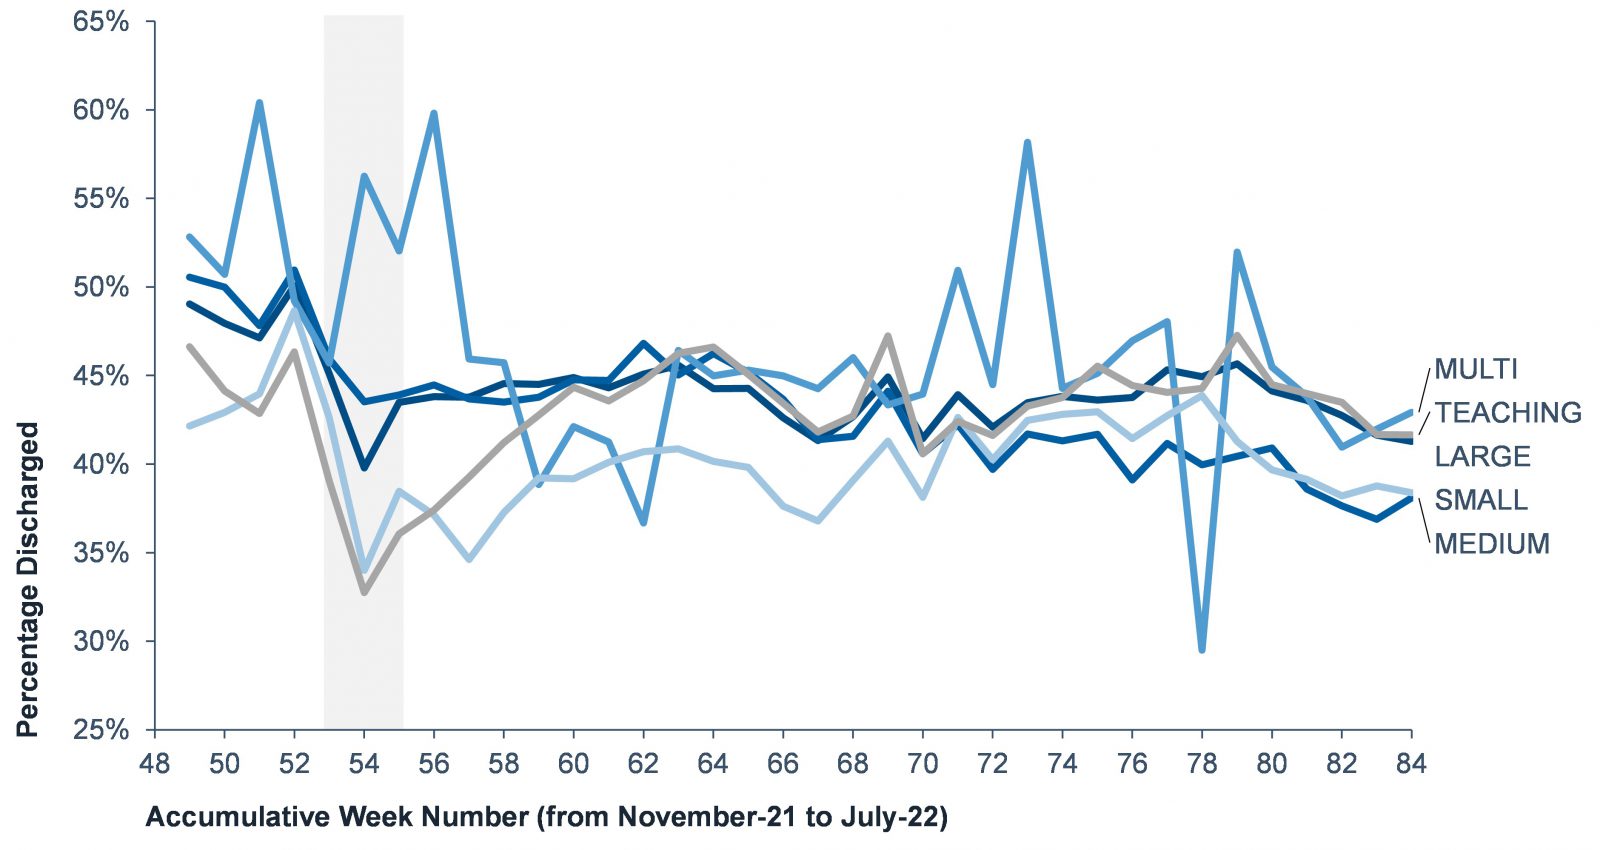
We further analysed discharge performance in terms of acute trust type which identified no significant trend. With exception for multi specialist trusts, performance follows the same profile. Regarding the scale or of Trust, suggesting that the economies of scale for large acute trusts, or the localised focus of smaller trusts, are not factors in discharge performance.
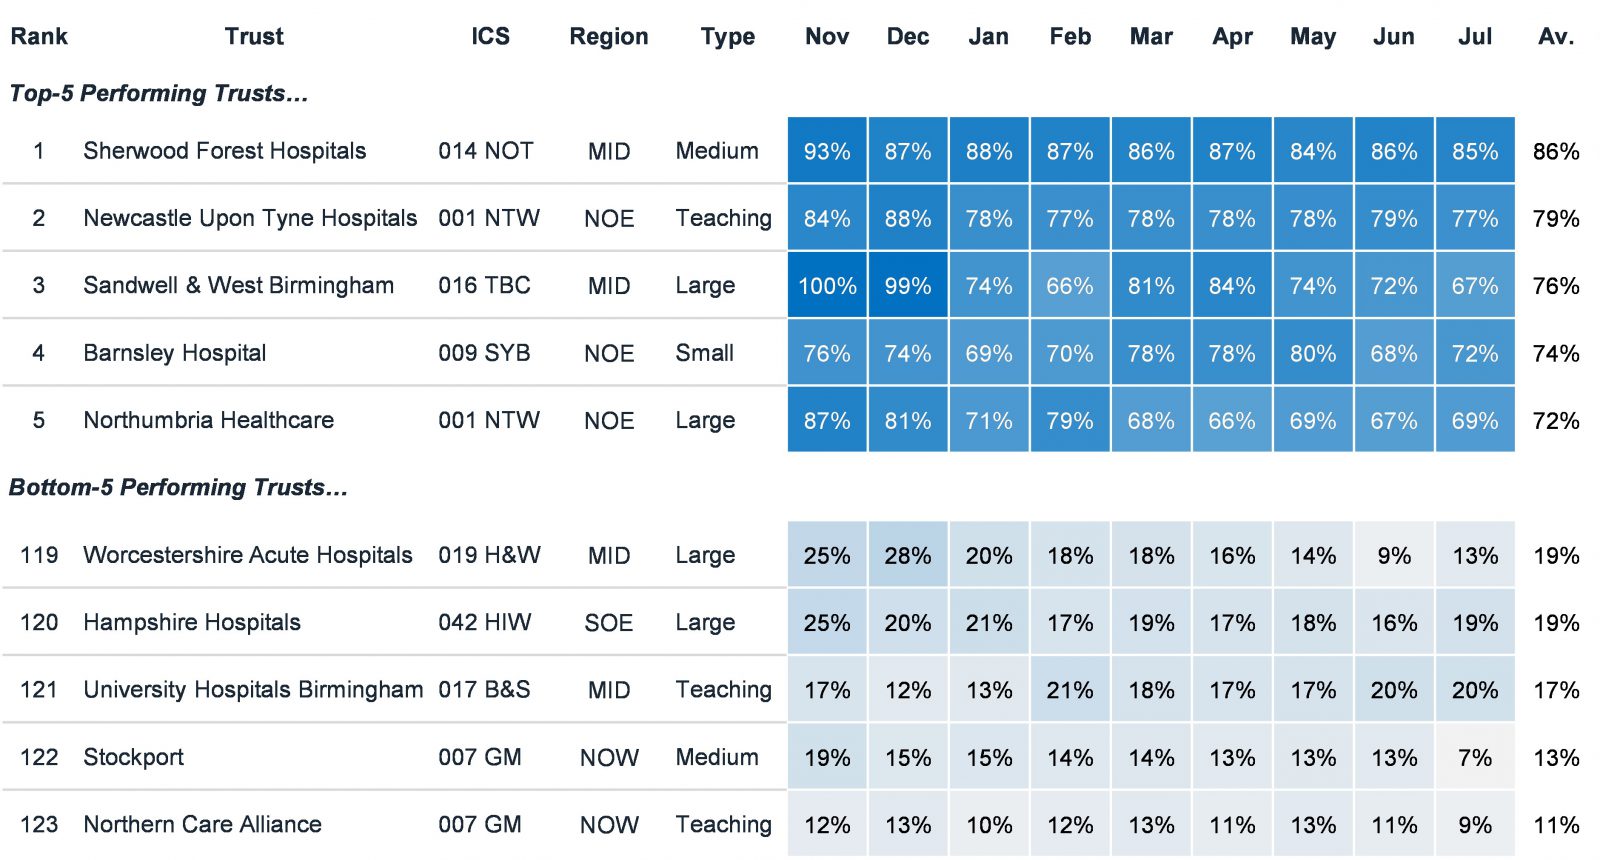
When looked at Trust level, there is again wide performance variation. The top-5 performing Trusts average ~78% discharge performance, whereas the bottom-5 Trusts average ~16%.
Responding to the discharge problem
Analysing the top and bottom-5 trusts in greater detail, it is apparent that Trust from all regions and types feature at both ends of the spectrum. The question, therefore, is what does this tell us about how providers can better respond to their discharge problems?
In answering this question, it is important to acknowledge that the analysis clearly points to this issue being universal. That is to say that discharge performance is not seemingly affected by geography, locality, Trust type or provision, or indeed by system, evidenced by wide ranging variation with ICS’s. The responses to the problem can therefore not be generic in line with the above factors. They must be organisational specific, in line with providers individual caseloads, models of care, and local leadership.
Various supportive materials, based on research and practical learnings from existing discharge-to-assess models, have been produced to encourage the adoption of discharge-to-assess principles in health and social care settings, in an effort to reduce the number of patients in acute settings with no right to stay.
All of this material has been summarized by Akeso into one useful framework. The next article in this series will focus on this framework designed to help ICSs and other organizations better understand what D2A requires in order to be successful.
References
[1] Akeso analysis of NHSE reported Delayed Transfers of Care, 2010-11 to 2019-20 – Number of Delayed Days during the reporting period, Acute and Non-Acute, for NHS Organisations in England by the type of care that the patient was receiving. https://www.england.nhs.uk/statistics/statistical-work-areas/delayed-transfers-of-care/delayed-transfers-of-care-data-2019-20/
[2] Akeso analysis of NHSE reported Covid-19 Daily Discharge Situation Report – All patients for 29 November 2021 – 30 July 2022. This data contains all inpatients 18 and over, including critical care and COVID-19 positive patients, but excluding paediatrics, maternity, and deceased patients. This includes data for acute trusts with a type 1 A&E department. Mental Health Trusts, specialised Trusts (including Children’s and Women’s Trusts) are not in scope of this collection.