
Keeping England’s blood supply safe and sustainable depends on more than recruiting new donors. It depends on understanding people, places and communities; who donates, who does not, what gets in the way, and where future demand is likely to come from.
In 2024–25, 341,630 people registered to give blood in England, but 166,311 (48.7%) people gave a first blood donation. This is a reminder that interest alone does not always translate into action.
That is where Population Health Management has something useful to offer, not as a technical exercise, but as a different way of seeing communities and planning around real lives.
Across the NHS, population health approaches are helping teams move beyond broad averages and build a clearer picture of the communities they serve.
How are they doing this?
- By combining demographic, geographic, socio-economic and behavioural data
- By helping organisations to understand variation, identify unmet need and make better decisions about where to focus effort
The same thinking can strengthen blood donation by helping teams understand both current donor behaviour and future opportunity.
Traditional segmentation by age, postcode, ethnicity or donation history, is important, but it only tells part of the story. Two communities may look similar on paper but behave very differently because of transport access, working patterns, deprivation, digital confidence, community networks or trust in public services.
For example, a low donation rate in one area may reflect limited access to donation venues; in another, it may reflect lower awareness, different cultural perceptions, or a lack of visible local engagement. The response in each place should be different, and better data can help make that possible.
Population intelligence enables organisations to ask better questions: not just where donation rates are low, but why they are low; not just who has donated before, but who has the potential to become a regular donor; not just where current centres are, but where future need may emerge. It turns broad patterns into practical insight and action.
For NHS Blood and Transplant, this could support more targeted engagement, better planning of mobile sessions, stronger understanding of underrepresented donor groups, and more meaningful comparisons between similar communities across England.
It is not about replacing national campaigns or local expertise. It is about giving those teams sharper insight, so decisions are grounded in a richer understanding of the people they are trying to reach.
It could also help make engagement more equitable. Some communities are underrepresented in the donor base, despite their vital role in meeting the needs of patients with specific blood requirements. A more population-led approach can help organisations understand where those gaps exist and how to respond in a way that feels relevant and locally grounded, while building trust.
At Akeso, our ÆgleEye population intelligence platform helps organisations compare genuinely similar populations, understand variation and identify opportunities for improvement. Applied to blood donation, the same approach could help build a clearer picture of donor potential, future demand and the communities most likely to benefit from tailored engagement.
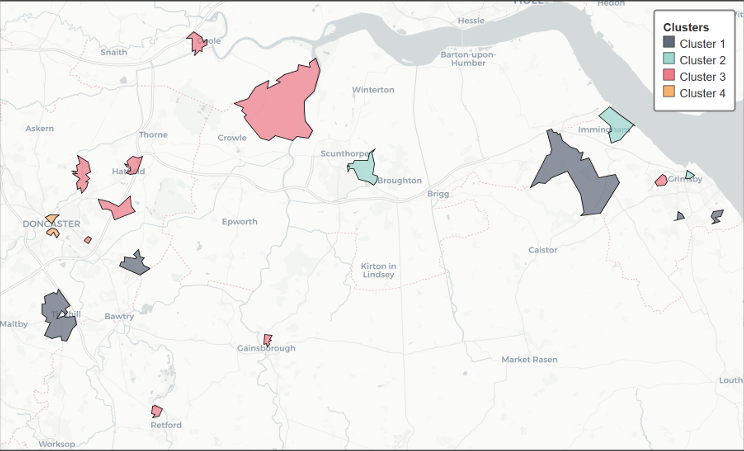
Figure 1: Geographic map portraying the spatial spread and classification of LSOAs. Shaded regions represent individual LSOAs, with colours indicating their assigned cluster.
A recent piece of analysis by our intern, Jude Lipson, shows what this looks like in practice. Working across 19 neighbourhoods in and around Doncaster, Jude used population intelligence to identify four distinct community types, each with its own relationship to digital services and care. Mapping those groups made the variation visible in a way that headline figures never could. Neighbourhoods sitting close together, and often looking alike on measures like age or deprivation, turned out to behave in very different ways.
Two of the groups make the point clearly. One was a younger population with lower educational attainment and poorer health, yet high digital confidence and a real appetite for digital services. Another was also younger and less formally educated, but faced genuine structural barriers instead, including limited English and thinner social support, which left them far less able to engage even where the willingness was there. On paper these two communities could easily be mistaken for one another. In practice they needed almost opposite responses.
What made this valuable was not describing who lived where, but understanding how people actually behaved around a service, and in particular why some were not using it. That is the difference between knowing a group looks disadvantaged and knowing whether the barrier is willingness, confidence, convenience or the way a service is designed. Each of those points to a different and specific local adjustment.
The same logic applies directly to blood donation. The value is not in spotting that a neighbourhood has a low donation rate, which the headline numbers already show. It is in understanding the behaviour behind that number: whether a community is willing but has never had a convenient session nearby, whether people have registered but something in the experience stops them following through, or whether donation has simply never been made to feel relevant to how they live and engage with public services. Two areas with near identical donor profiles can sit on opposite sides of that line. Population intelligence is what surfaces the difference, and it is what lets teams make specific, evidenced local adjustments to lift donation rather than relying on assumptions.
The opportunity is to move from a general call to action to a more precise understanding of where, how and with whom that call to action is most likely to make a difference.
Blood donation will always rely on generosity and trust. Better population intelligence can help make sure that generosity is understood, supported and planned for now and in the future.